Visualize Child Device Data Using Grafana
2 min
You can visualize the data a device publishes to Belden Horizon Data Manager using Grafana.
Visualize Data in Grafana
To visualize data in Grafana: 1. Make sure your child device data in Belden Horizon Data Manager is displaying correctly. See View Data from an Edge Device or a Child Device. 2. From the navigation panel, select Features. The Features pane appears. 3. Click the Grafana Dashboards tile. Grafana opens in a new browser tab. 4. From the Grafana navigation panel, click the Dashboards icon, and then select Browse from the menu. The Dashboards pane appears. 5. Click the Samples folder. This is available by default. 6. Click the PLC Tag Browser link. The graph loads.
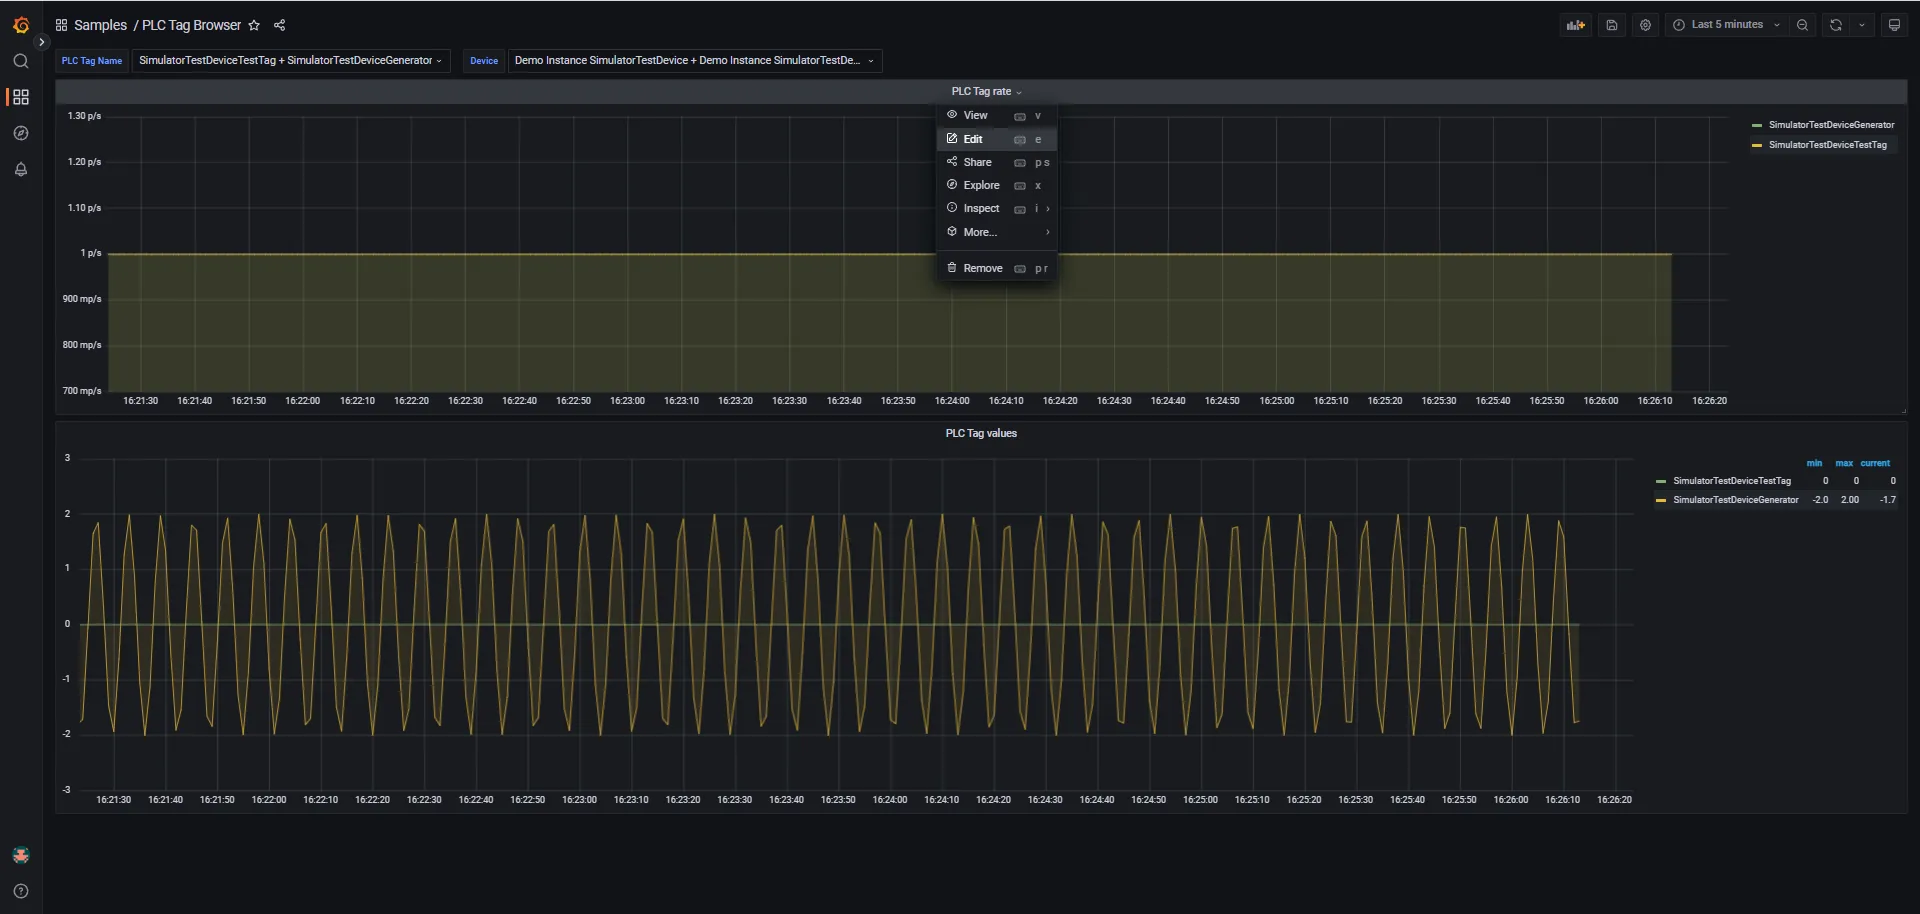
Grafana Visualized Data of Child Devices
Customize the Grafana Data Visualization
To customize the Grafana data visualization:
- Use the PLC Tag Name drop-down list to select tag(s) to display.
- Use the Device drop-down list to select the child device(s) to display.
- From the top right corner, use the dashboard's toolbar options to change the graphs' time range and refresh interval.
- From the PLC Tag rates drop-down list, select the Edit option. The PLC Tag Browser > Edit Panel pane appears.
- Hover over the chart to view specific values.
- From the bottom right corner, use the Query tab to view and edit the various queries used in the chart.
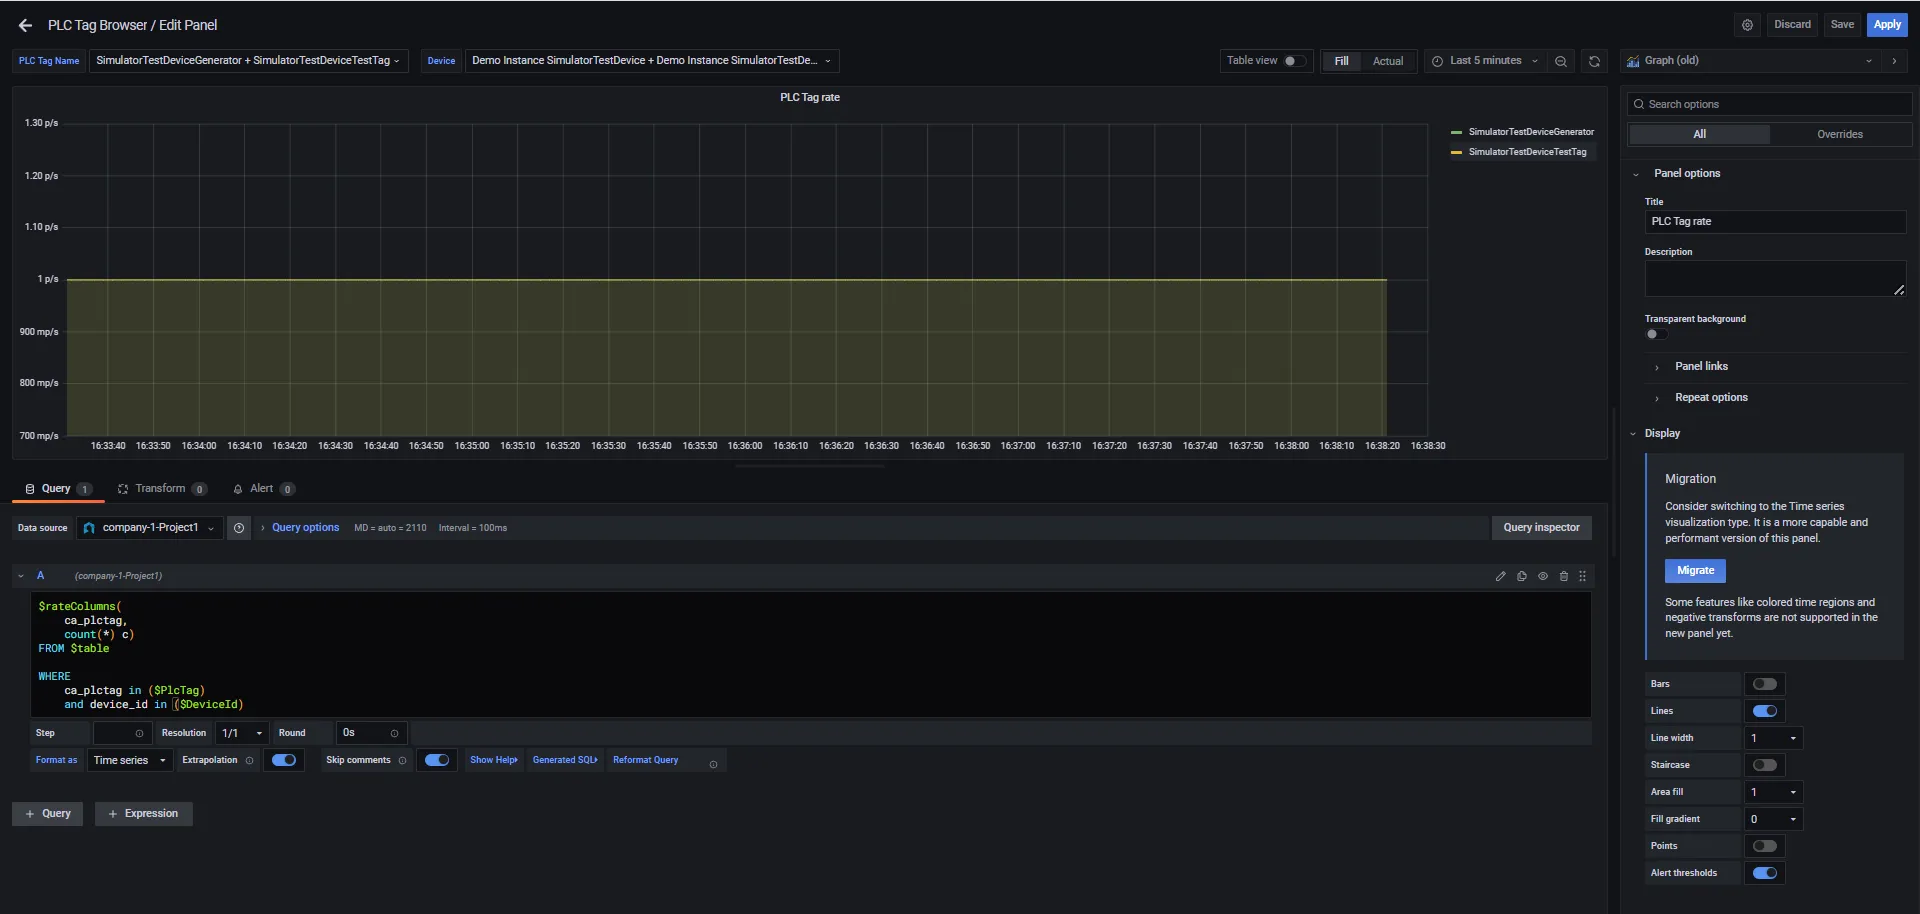
Grafana : PLC Tag Browser > Edit Panel