Admin Console Dashboard
The Dashboard provides you with a comprehensive overview about the Belden Horizon Data Manager.
From the Dashboard pane, you can view the total number of companies, projects, Belden Horizon Data Operations, total database size and total number of messages. It includes charts, graphs, and statistics for System Overview, CPU, and Disk Usage.
Access Dashboard UI
To access the dashboard UI:
1. Log in to Belden Horizon Data Manager Admin Console.
2. From the Navigation panel, select Dashboard. The Dashboard pane appears. The user interface below is for Belden Horizon Data Manager version 2.10.0 and later.
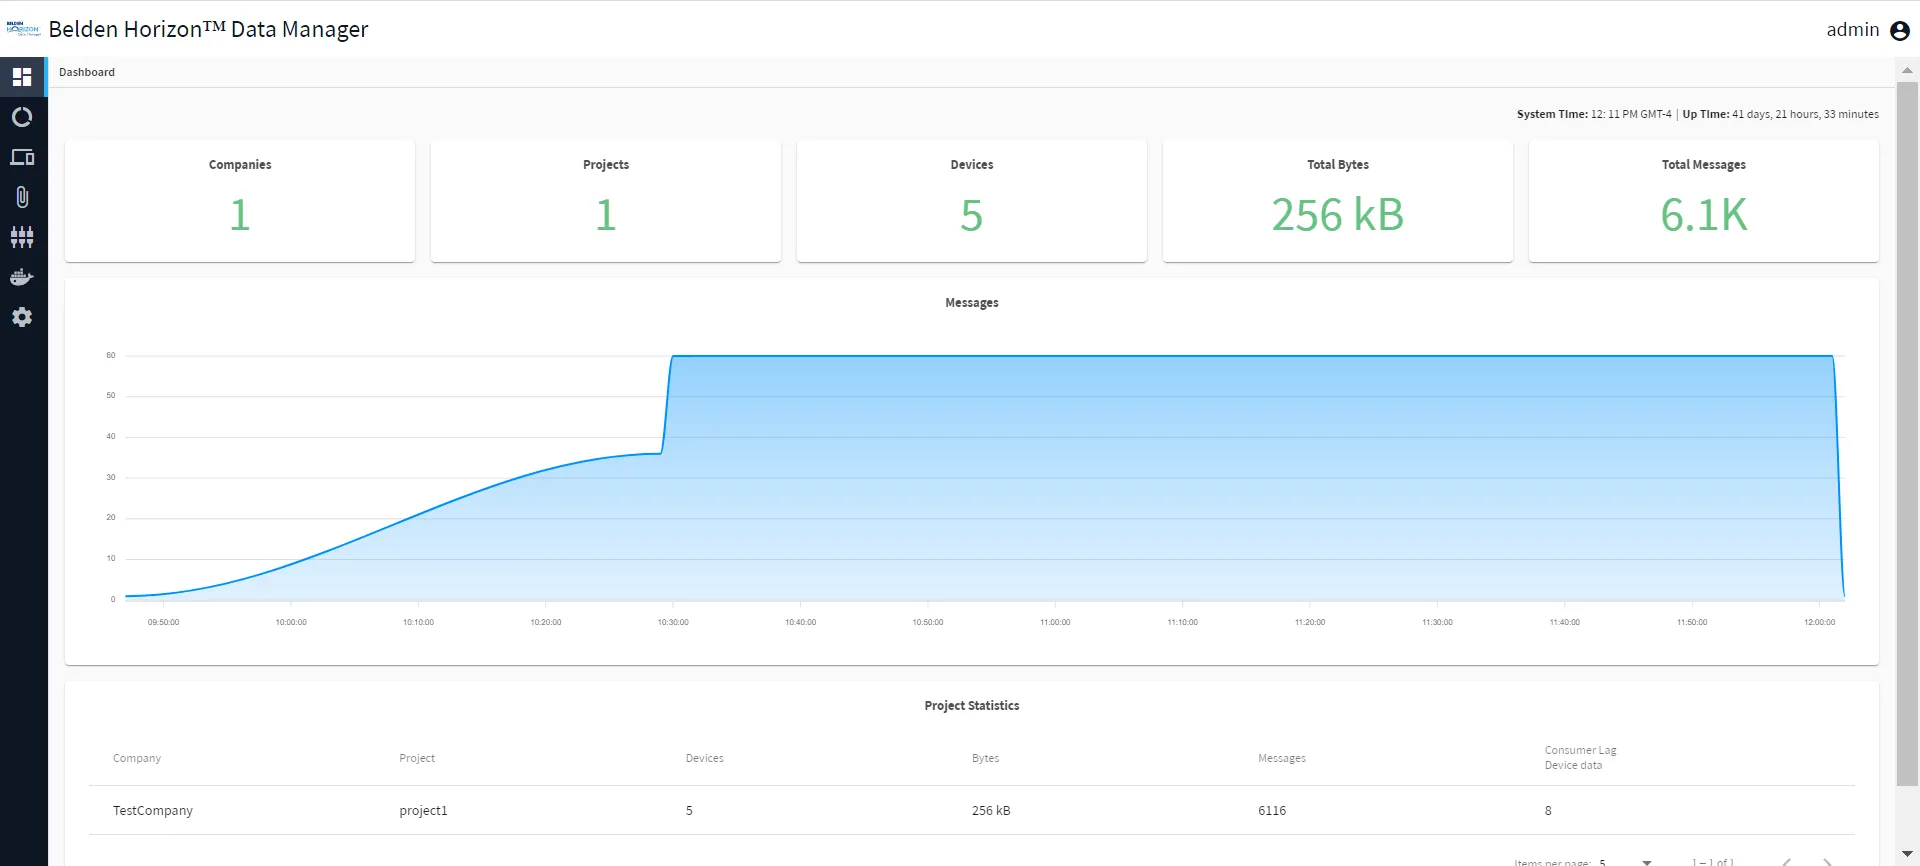
Dashboard Deployment and Messages Chart
From the main Dashboard Deployment heading, it provides an overview about which edge device deployments are configured on the Belden Horizon Data Manager. It also allows you to monitor how the edge device deployments influence the resources like CPU, Disk storage or Network traffic of Belden Horizon Data Manager and take action to ensure the highest availability. You can view:
- The number of Companies
- The number of Projects
- The number of edge devices, including statistics like Total bytes transferred and Total Messages transferred.
The Messages chart allows you to monitor the quantity of messages received over time. This allows you to identify slack time or anomalies in the quantity of data received from your edge devices. You can view statistics for the quantity of edge device messages received at a given time from this chart. You can view a point in time for the chart.
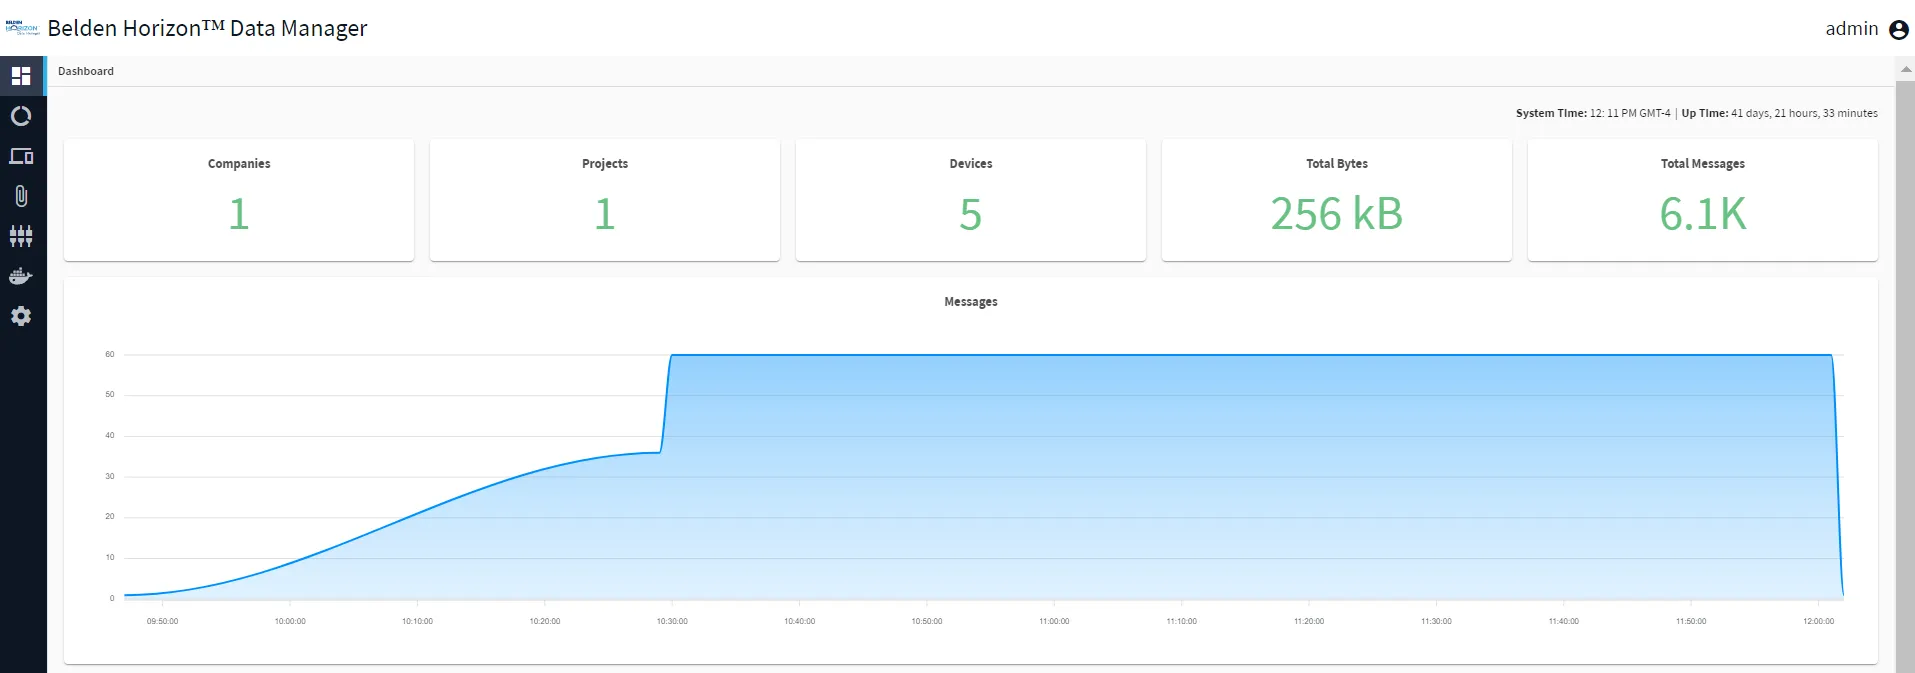
System Time / Local Time Warning
Note: The System Time / Local Time Warning feature is available for Belden Horizon Data Manager version 2.10.0 and later.
If the Belden Horizon Data Manager's System Time differs from your device's Local Time by 10 minutes, a warning will be displayed.

Project Statistics
From the Project Statistic table, you can view a table showing:
- The company name
- The project name
- The quantity of edge devices associated with the project
- The number of bytes used for a project
- The number of messages received for the connected edge devices
- The instances of Consumer Lag Device Data (the delta between the Latest Offset and Consumer Offset)
