Dashboard
The dashboard contains statistics about the whole system. This information is on the operational network and is completely offline.
Dashboard Data
Once you connect devices to Belden Horizon Data Operations , you can use the dashboard for monitoring. Refer to the sections below.
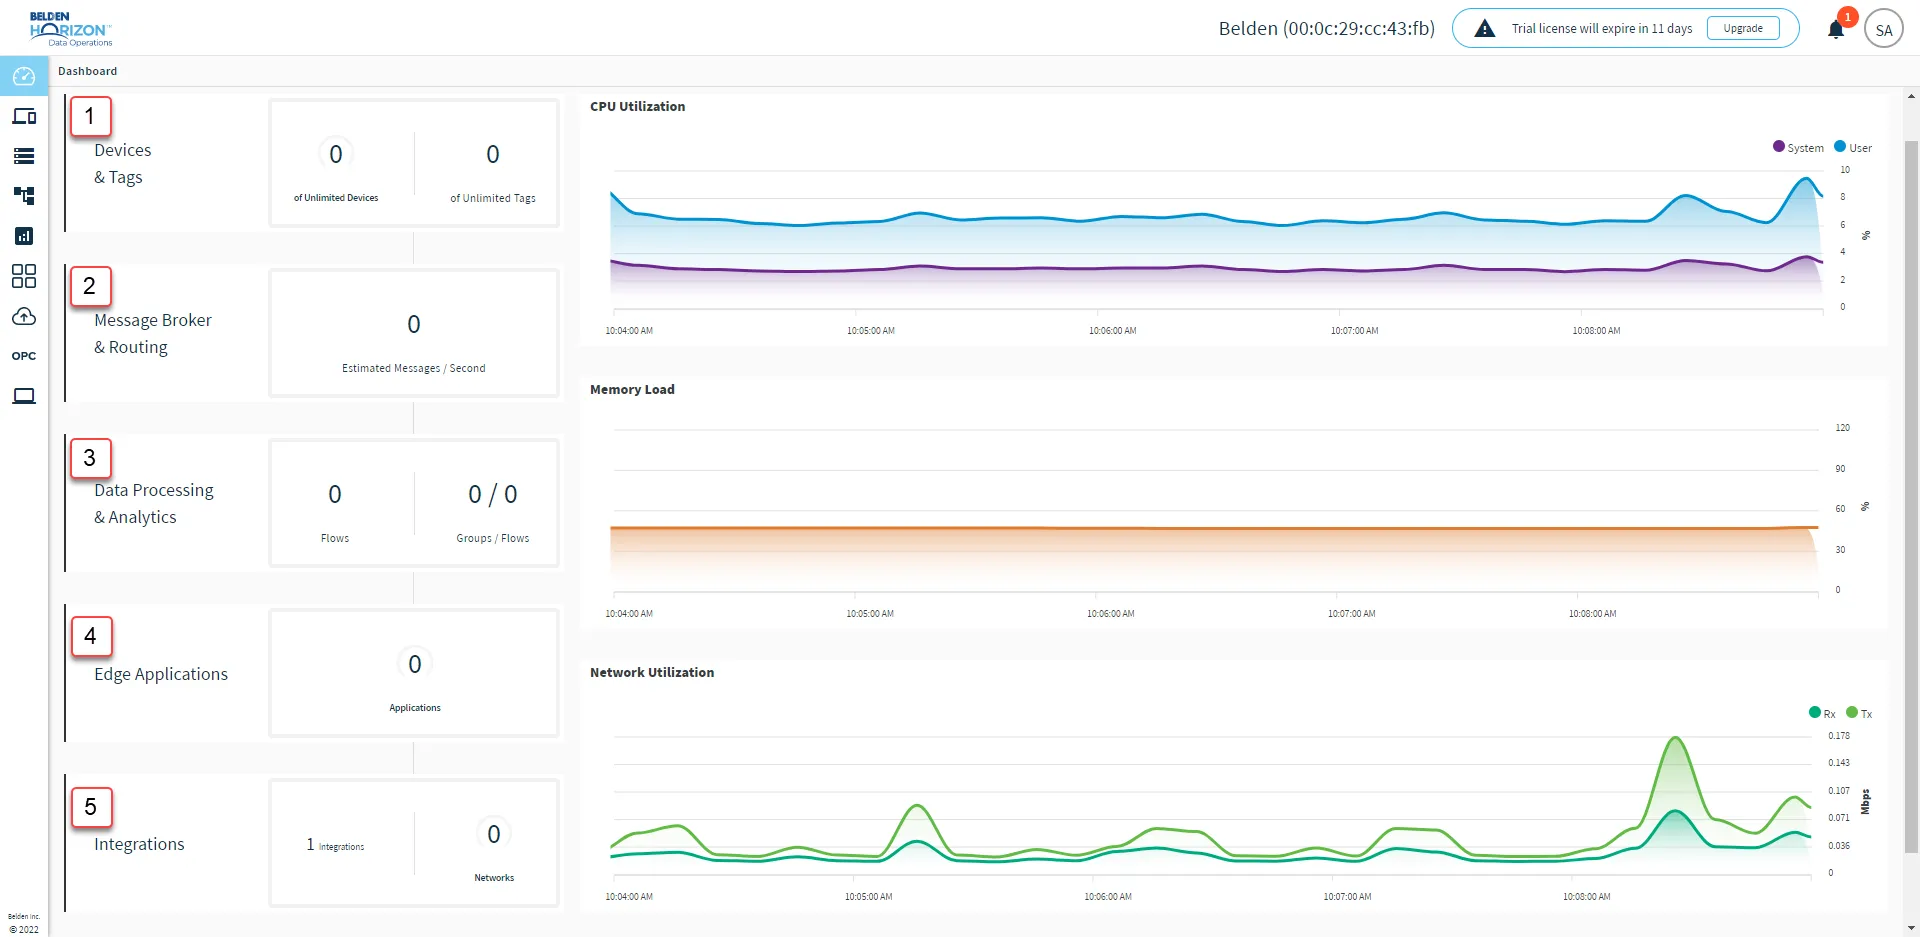
[1] Devices & Tags: The number of connected devices and tags on your system.
[2] Message Broker & Routing: Collected data is normalized or standardized and then published to the local message broker. This section displays the message rate of this process.
[3] Data Processing & Analytics: The number of flows, analytics flows, and groups that are running.
[4] Edge Applications: The number of installed applications. These applications are localized applications and containers.
[5] Integrations: The number of connections to the cloud and the number of remotely connected networks. These integrations are the cloud and database systems that have been installed to receive collected data using OPC UA.
Dashboard Charts
You can view preset charts that contain data about your system:
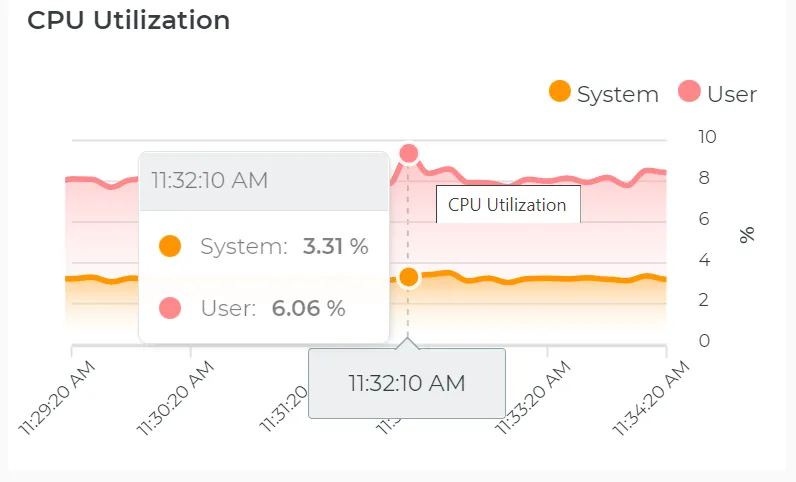
CPU Utilization
Displays the usage of processing resources over time for the IUD Gateway, industrial PCs, all virtual machines, and the user.
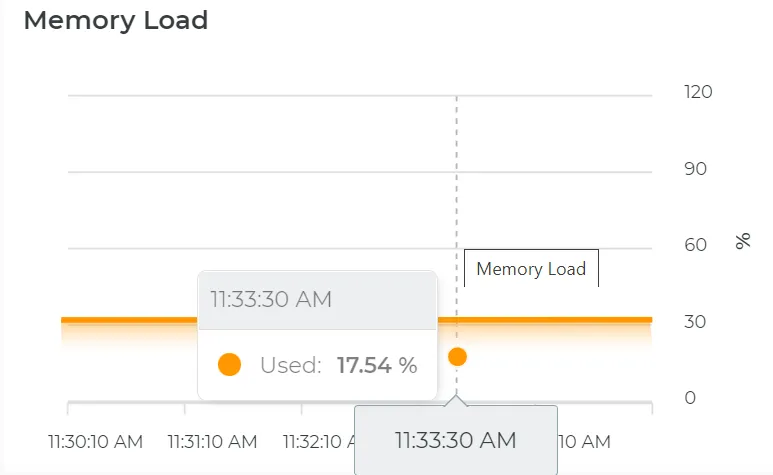
Memory Load
Displays the memory usage for the system over time
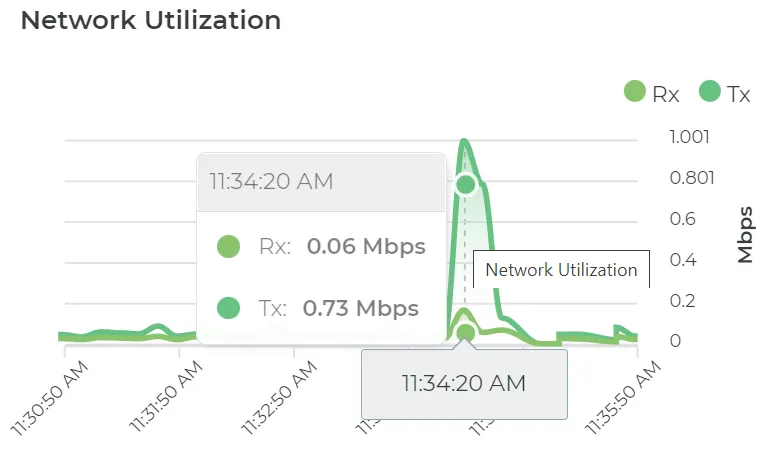
Network Utilization
Displays the received and transmitted network speed in Mbps (megabits per second) over time.
At the bottom of the Dashboard, you can find status indicators for the modules included in your plan. When you hover over each status indicator, the version of the selected module appears. Each indicator displays a colored circle reflecting the online status of the selected module:

Color | Health |
|---|---|
Green | Services are up |
Red | Services are down |
Next to the indicators you can view your Storage utilization.
Tip: You can move you cursor horizontally over the charts to view data for additional dates.